Self-storage and building solutions company Janus (NYSE:JBI) fell short of the market’s revenue expectations in Q3 CY2024, with sales falling 17.9% year on year to $230.1 million. The company’s full-year revenue guidance of $917.5 million at the midpoint also came in 8.7% below analysts’ estimates. Its non-GAAP profit of $0.11 per share was also 46.1% below analysts’ consensus estimates.
Is now the time to buy Janus? Find out by accessing our full research report, it’s free.
Janus (JBI) Q3 CY2024 Highlights:
- Revenue: $230.1 million vs analyst estimates of $248.2 million (7.3% miss)
- Adjusted EPS: $0.11 vs analyst expectations of $0.20 (46.1% miss)
- EBITDA: $43.1 million vs analyst estimates of $63.85 million (32.5% miss)
- The company dropped its revenue guidance for the full year to $917.5 million at the midpoint from $1.02 billion, a 10% decrease
- EBITDA guidance for the full year is $200 million at the midpoint, below analyst estimates of $260.6 million
- Gross Margin (GAAP): 39.6%, down from 42.5% in the same quarter last year
- Operating Margin: 12.8%, down from 23.7% in the same quarter last year
- EBITDA Margin: 18.7%, down from 27.2% in the same quarter last year
- Free Cash Flow Margin: 17.1%, similar to the same quarter last year
- Market Capitalization: $1.50 billion
“We saw continued pressure in the third quarter as headwinds from macroeconomic factors, interest rate uncertainty and project delays persisted,” said Ramey Jackson, Chief Executive Officer.
Company Overview
Standing out with its digital keyless entry into self-storage room technology, Janus (NYSE:JBI) is a provider of easily accessible self-storage solutions.
Commercial Building Products
Commercial building products companies, which often serve more complicated projects, can supplement their core business with higher-margin installation and consulting services revenues. More recently, advances to address labor availability and job site productivity have spurred innovation. Additionally, companies in the space that can produce more energy-efficient materials have opportunities to take share. However, these companies are at the whim of commercial construction volumes, which tend to be cyclical and can be impacted heavily by economic factors such as interest rates. Additionally, the costs of raw materials can be driven by a myriad of worldwide factors and greatly influence the profitability of commercial building products companies.
Sales Growth
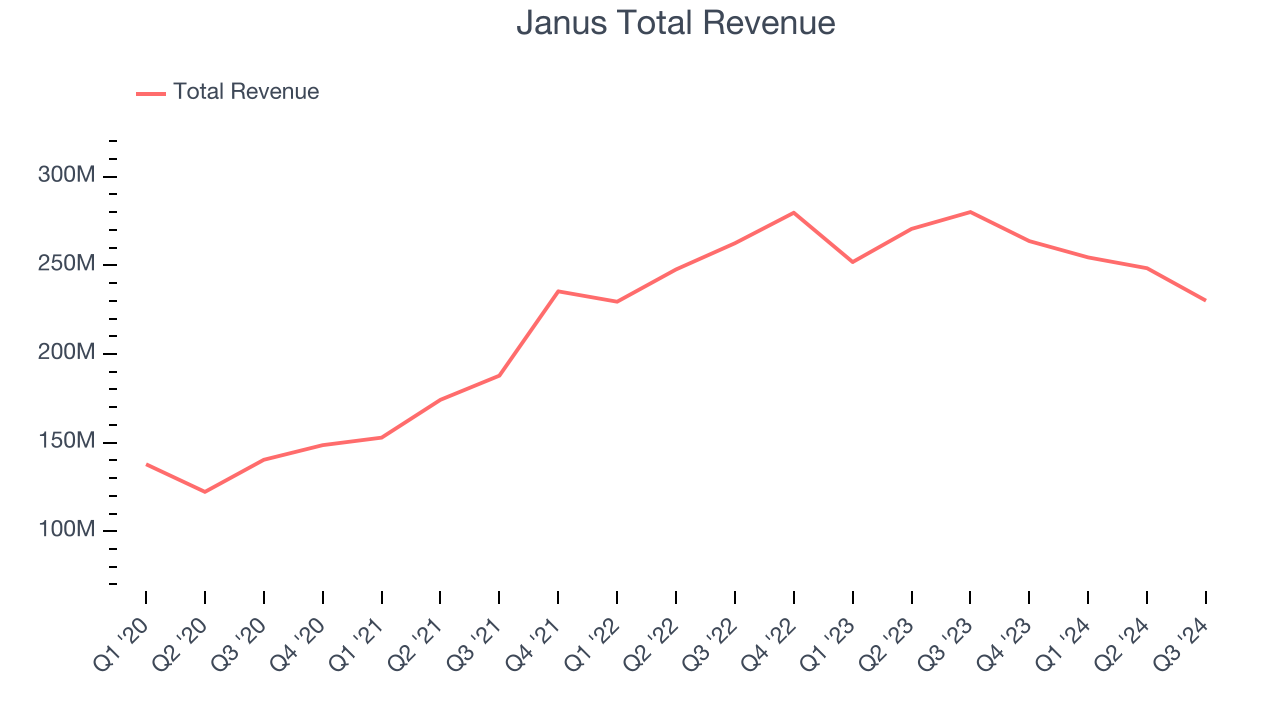
Reviewing a company’s long-term performance can reveal insights into its business quality. Any business can have short-term success, but a top-tier one sustains growth for years. Luckily, Janus’s sales grew at an incredible 16.3% compounded annual growth rate over the last four years. This is a useful starting point for our analysis.

Long-term growth is the most important, but within industrials, a stretched historical view may miss new industry trends or demand cycles. Janus’s recent history shows its demand slowed significantly as its annualized revenue growth of 1.1% over the last two years is well below its four-year trend. 
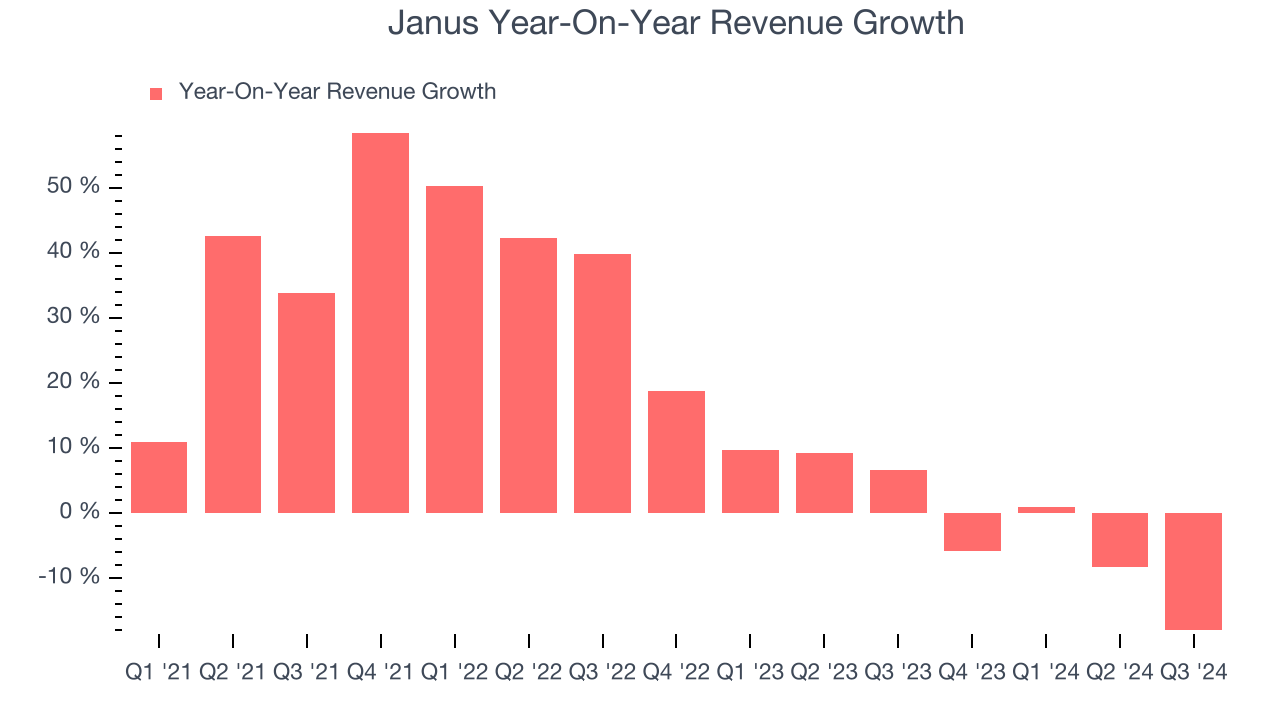
This quarter, Janus missed Wall Street’s estimates and reported a rather uninspiring 17.9% year-on-year revenue decline, generating $230.1 million of revenue.
Looking ahead, sell-side analysts expect revenue to grow 3.2% over the next 12 months. Although this projection illustrates the market believes its newer products and services will catalyze better performance, it is still below average for the sector.
Unless you’ve been living under a rock, it should be obvious by now that generative AI is going to have a huge impact on how large corporations do business. While Nvidia and AMD are trading close to all-time highs, we prefer a lesser-known (but still profitable) semiconductor stock benefitting from the rise of AI. Click here to access our free report on our favorite semiconductor growth story.
Operating Margin
Operating margin is an important measure of profitability as it shows the portion of revenue left after accounting for all core expenses–everything from the cost of goods sold to advertising and wages. It’s also useful for comparing profitability across companies with different levels of debt and tax rates because it excludes interest and taxes.
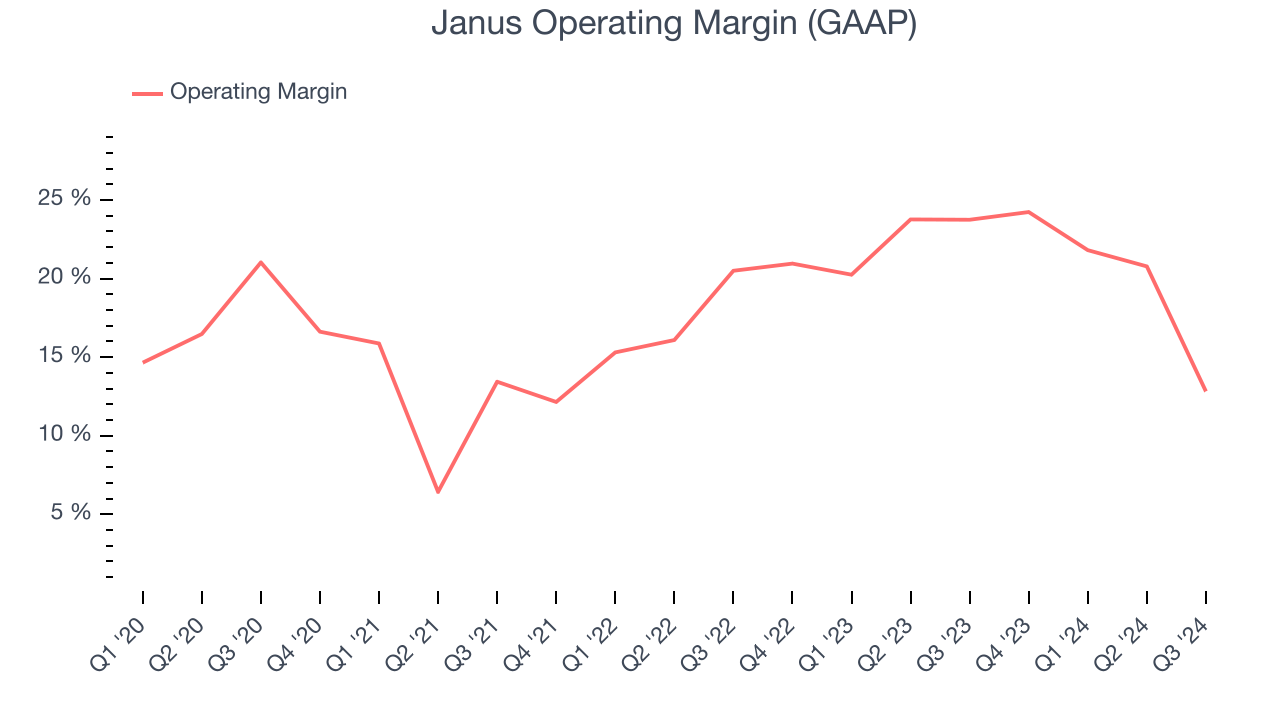
Janus has been a well-oiled machine over the last five years. It demonstrated elite profitability for an industrials business, boasting an average operating margin of 18.3%. This result isn’t surprising as its high gross margin gives it a favorable starting point.
Looking at the trend in its profitability, Janus’s annual operating margin rose by 1.2 percentage points over the last five years, as its sales growth gave it operating leverage.

This quarter, Janus generated an operating profit margin of 12.8%, down 10.9 percentage points year on year. Since Janus’s operating margin decreased more than its gross margin, we can assume it was recently less efficient because expenses such as marketing, R&D, and administrative overhead increased.
Earnings Per Share
Analyzing revenue trends tells us about a company’s historical growth, but the long-term change in its earnings per share (EPS) points to the profitability of that growth – for example, a company could inflate its sales through excessive spending on advertising and promotions.
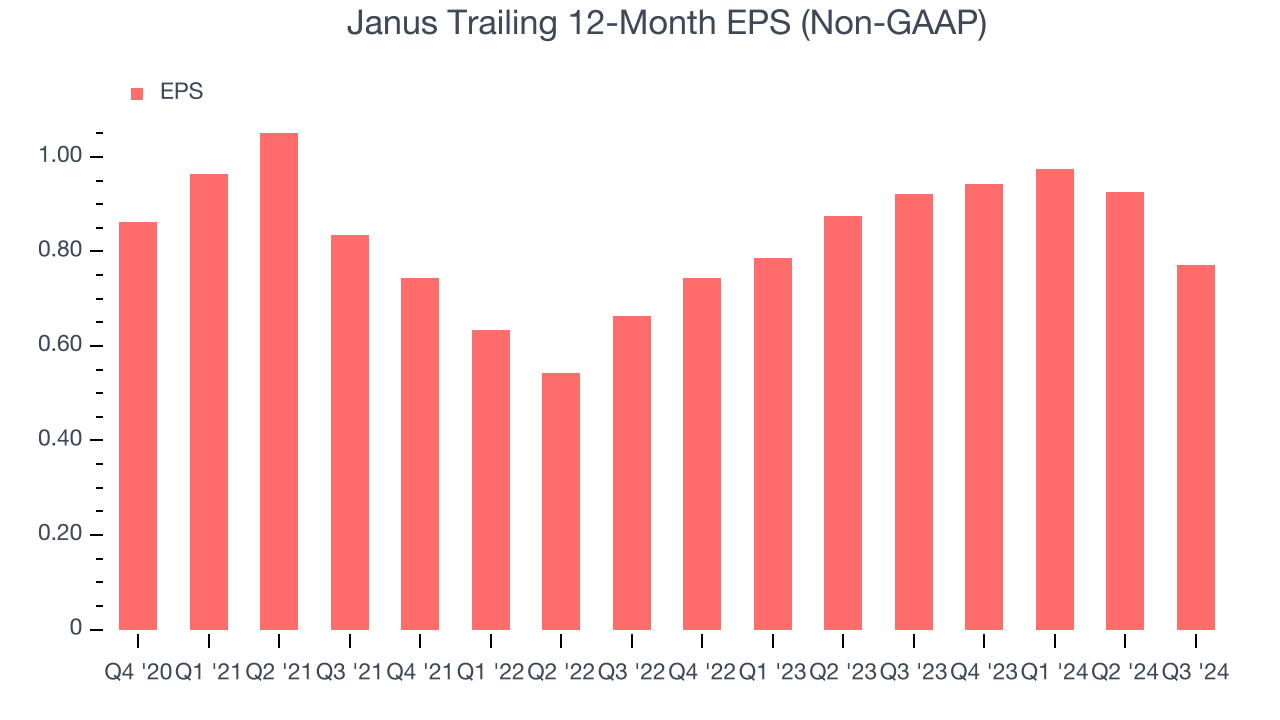
Sadly for Janus, its EPS declined by 4.3% annually over the last four years while its revenue grew by 16.3%. However, its operating margin actually expanded during this timeframe, telling us that non-fundamental factors affected its ultimate earnings.

Like with revenue, we analyze EPS over a more recent period because it can give insight into an emerging theme or development for the business.
For Janus, its two-year annual EPS growth of 7.9% was higher than its four-year trend. Accelerating earnings growth is almost always an encouraging data point.In Q3, Janus reported EPS at $0.11, down from $0.27 in the same quarter last year. This print missed analysts’ estimates. We also like to analyze expected EPS growth based on Wall Street analysts’ consensus projections, but there is insufficient data.
Key Takeaways from Janus’s Q3 Results
We struggled to find many strong positives in these results. Its full-year revenue guidance missed and its EBITDA guidance for the full year fell short of Wall Street’s estimates. Overall, this was a softer quarter. The stock traded down 13.2% to $8.95 immediately after reporting.
Janus’s earnings report left more to be desired. Let’s look forward to see if this quarter has created an opportunity to buy the stock. We think that the latest quarter is only one piece of the longer-term business quality puzzle. Quality, when combined with valuation, can help determine if the stock is a buy. We cover that in our actionable full research report which you can read here, it’s free.


