
Marine transportation service company Kirby (NYSE:KEX) met Wall Street’s revenue expectations in Q3 CY2024, with sales up 8.7% year on year to $831.1 million. Its GAAP profit of $1.55 per share was 5.4% above analysts’ consensus estimates.
Is now the time to buy Kirby? Find out by accessing our full research report, it’s free.
Kirby (KEX) Q3 CY2024 Highlights:
- Revenue: $831.1 million vs analyst estimates of $823.8 million (in line)
- EPS: $1.55 vs analyst estimates of $1.47 (5.4% beat)
- EBITDA: $190.5 million vs analyst estimates of $182.9 million (4.1% beat)
- Gross Margin (GAAP): 33.6%, up from 30.6% in the same quarter last year
- Operating Margin: 15.3%, up from 12.2% in the same quarter last year
- EBITDA Margin: 22.9%, up from 19.2% in the same quarter last year
- Free Cash Flow was $130.1 million, up from -$7.44 million in the same quarter last year
- Market Capitalization: $7.12 billion
David Grzebinski, Kirby’s Chief Executive Officer, commented, “Our third quarter results reflected steady market fundamentals in both marine transportation and distribution and services, even though we experienced some modest weather and navigational challenges for marine and continued supply challenges in distribution and services. These headwinds were mostly offset by good execution in both marine and distribution and services during the quarter that led to strong financial performance, with total revenues up 9% and earnings per share up 48% year-over-year.
Company Overview
Transporting goods along all three U.S. coasts, Kirby (NYSE:KEX) provides inland and coastal marine transportation services.
Marine Transportation
The growth of e-commerce and global trade continues to drive demand for shipping services, presenting opportunities for marine transportation companies. While ocean freight is more fuel efficient and therefore cheaper than its air and ground counterparts, it results in slower delivery times, presenting a trade off. To improve transit speeds, the industry continues to invest in digitization to optimize fleets and routes. However, marine transportation companies are still at the whim of economic cycles. Consumer spending, for example, can greatly impact the demand for these companies’ offerings while fuel costs can influence profit margins. Geopolitical tensions can also affect access to trade routes, and if certain countries are banned from using passageways like the Panama Canal, costs can spiral out of control.
Sales Growth
Examining a company’s long-term performance can provide clues about its business quality. Any business can put up a good quarter or two, but the best consistently grow over the long haul. Regrettably, Kirby’s sales grew at a sluggish 2.4% compounded annual growth rate over the last five years. This shows it failed to expand in any major way, a rough starting point for our analysis.
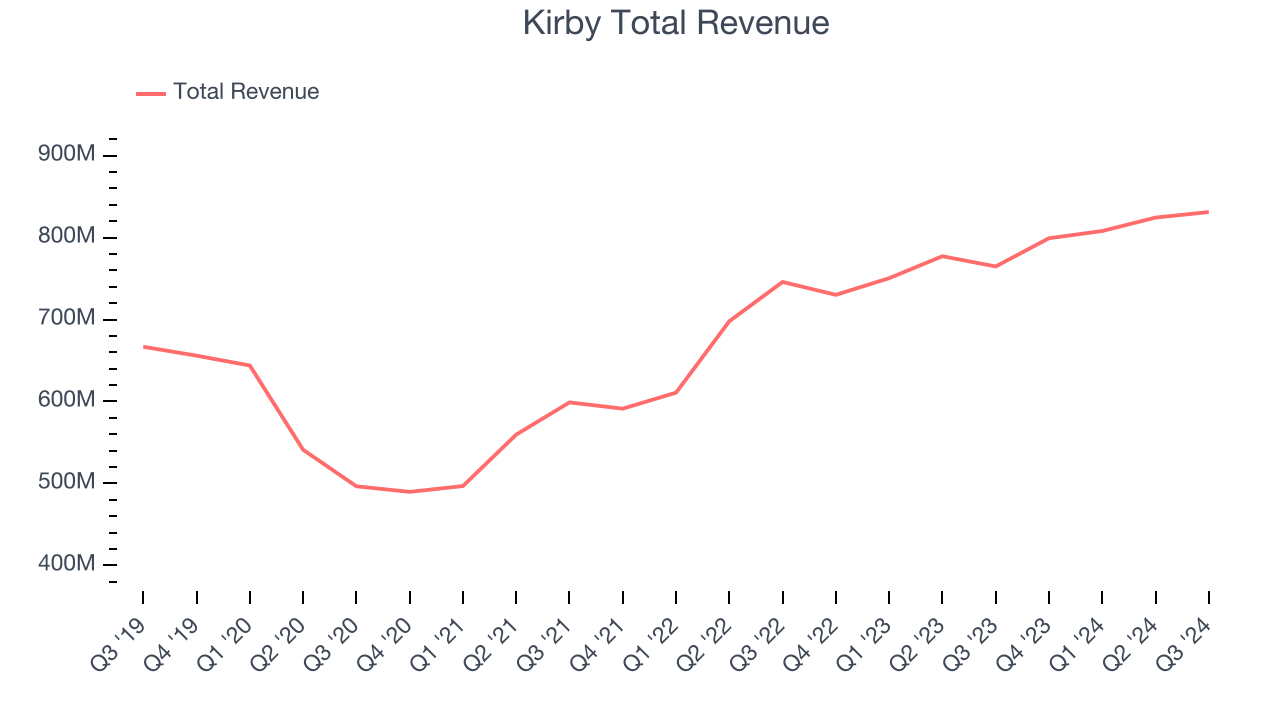
Long-term growth is the most important, but within industrials, a half-decade historical view may miss new industry trends or demand cycles. Kirby’s annualized revenue growth of 11% over the last two years is above its five-year trend, suggesting its demand recently accelerated. Kirby’s recent history shows it’s one of the better Marine Transportation businesses as many of its peers faced declining sales because of cyclical headwinds. 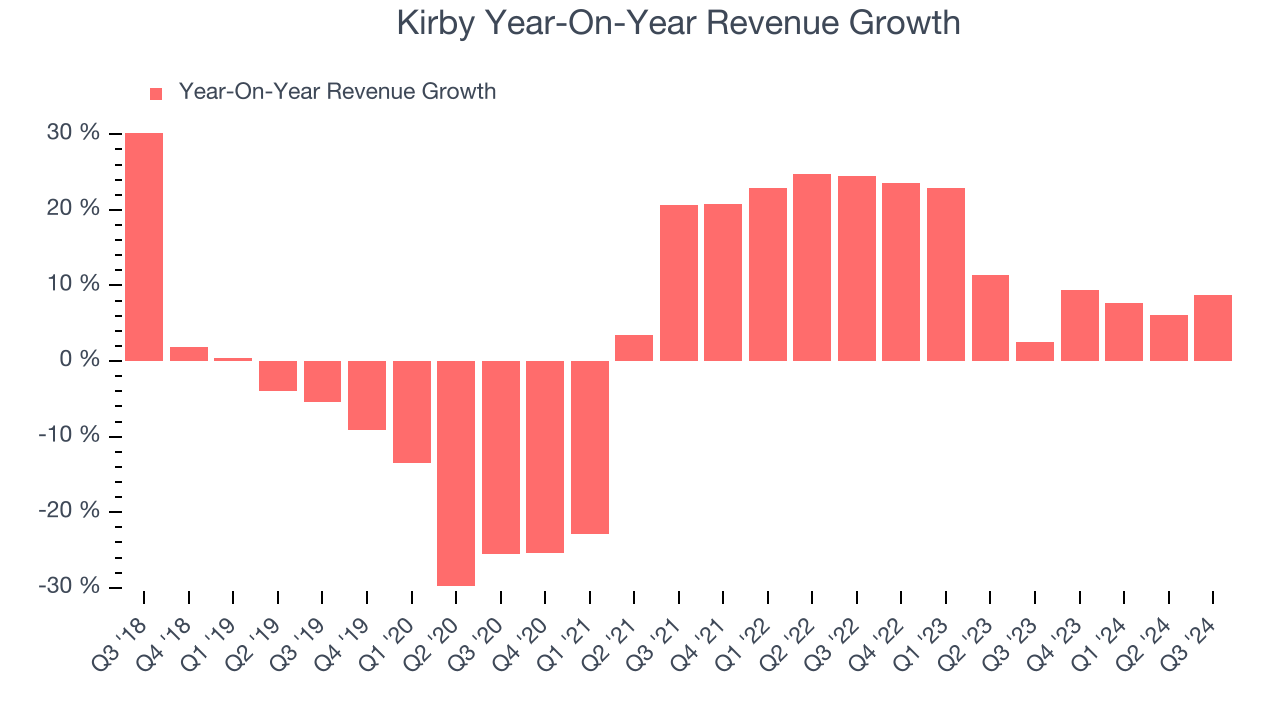
Kirby also breaks out the revenue for its most important segments, Marine Transportation and Distribution and Services, which are 58.5% and 41.5% of revenue. Over the last two years, Kirby’s Marine Transportation revenue (petroleum products and chemicals) averaged 11.3% year-on-year growth while its Distribution and Services revenue (aftermarket parts and equipment) averaged 12.3% growth.
This quarter, Kirby grew its revenue by 8.7% year on year, and its $831.1 million of revenue was in line with Wall Street’s estimates.
Looking ahead, sell-side analysts expect revenue to grow 6% over the next 12 months, a deceleration versus the last two years. This projection is underwhelming and indicates the market believes its products and services will see some demand headwinds. At least the company is tracking well in other measures of financial health.
When a company has more cash than it knows what to do with, buying back its own shares can make a lot of sense–as long as the price is right. Luckily, we’ve found one, a low-priced stock that is gushing free cash flow AND buying back shares. Click here to claim your Special Free Report on a fallen angel growth story that is already recovering from a setback.
Operating Margin
Kirby was profitable over the last five years but held back by its large cost base. Its average operating margin of 1.6% was weak for an industrials business. This result isn’t too surprising given its low gross margin as a starting point.
On the bright side, Kirby’s annual operating margin rose by 31.9 percentage points over the last five years.
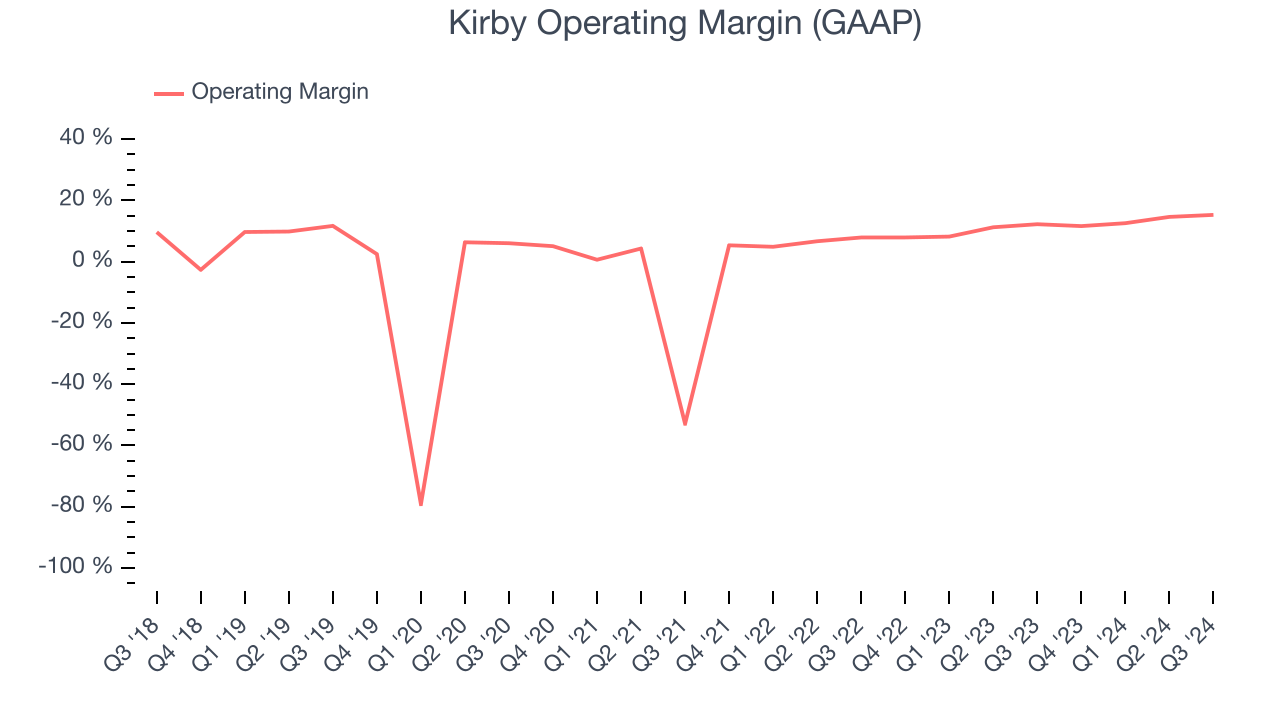
In Q3, Kirby generated an operating profit margin of 15.3%, up 3 percentage points year on year. The increase was encouraging, and since its operating margin rose more than its gross margin, we can infer it was recently more efficient with expenses such as marketing, R&D, and administrative overhead.
Earnings Per Share
Analyzing revenue trends tells us about a company’s historical growth, but the long-term change in its earnings per share (EPS) points to the profitability of that growth – for example, a company could inflate its sales through excessive spending on advertising and promotions.
Kirby’s EPS grew at an astounding 22.1% compounded annual growth rate over the last five years, higher than its 2.4% annualized revenue growth. This tells us the company became more profitable as it expanded.
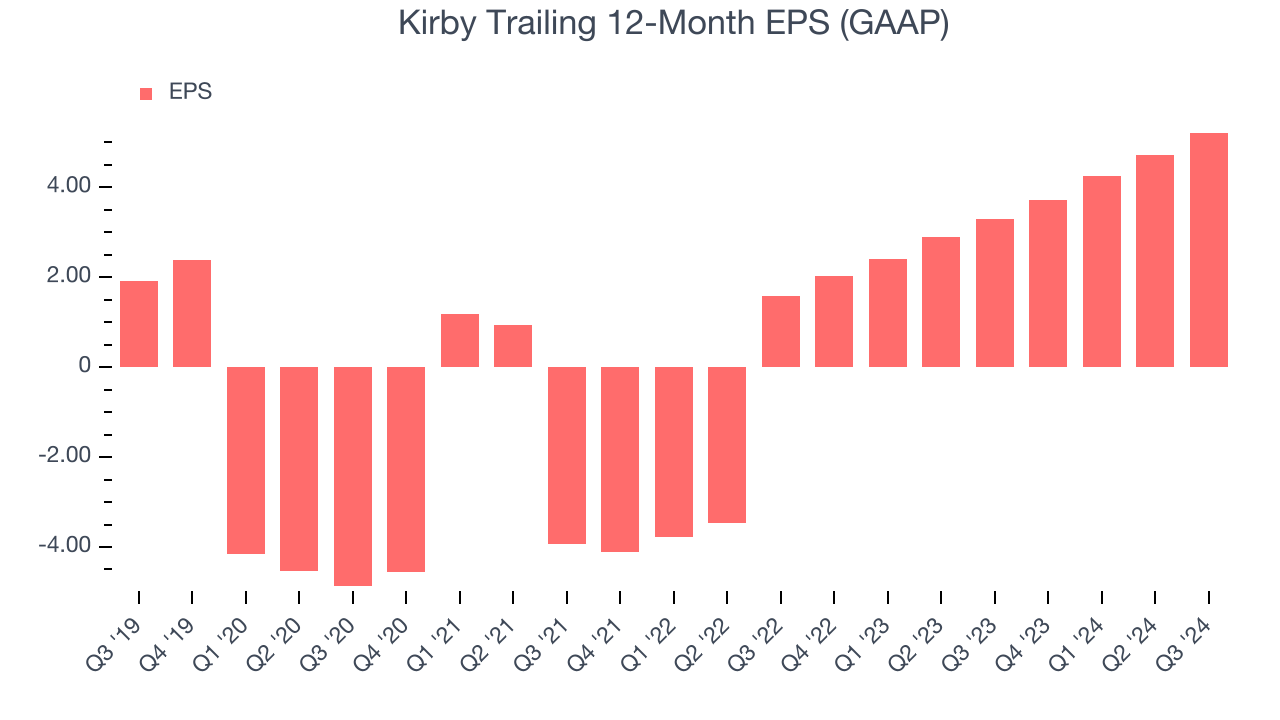
We can take a deeper look into Kirby’s earnings quality to better understand the drivers of its performance. As we mentioned earlier, Kirby’s operating margin expanded by 31.9 percentage points over the last five years. On top of that, its share count shrank by 2.9%. These are positive signs for shareholders because improving profitability and share buybacks turbocharge EPS growth relative to revenue growth. 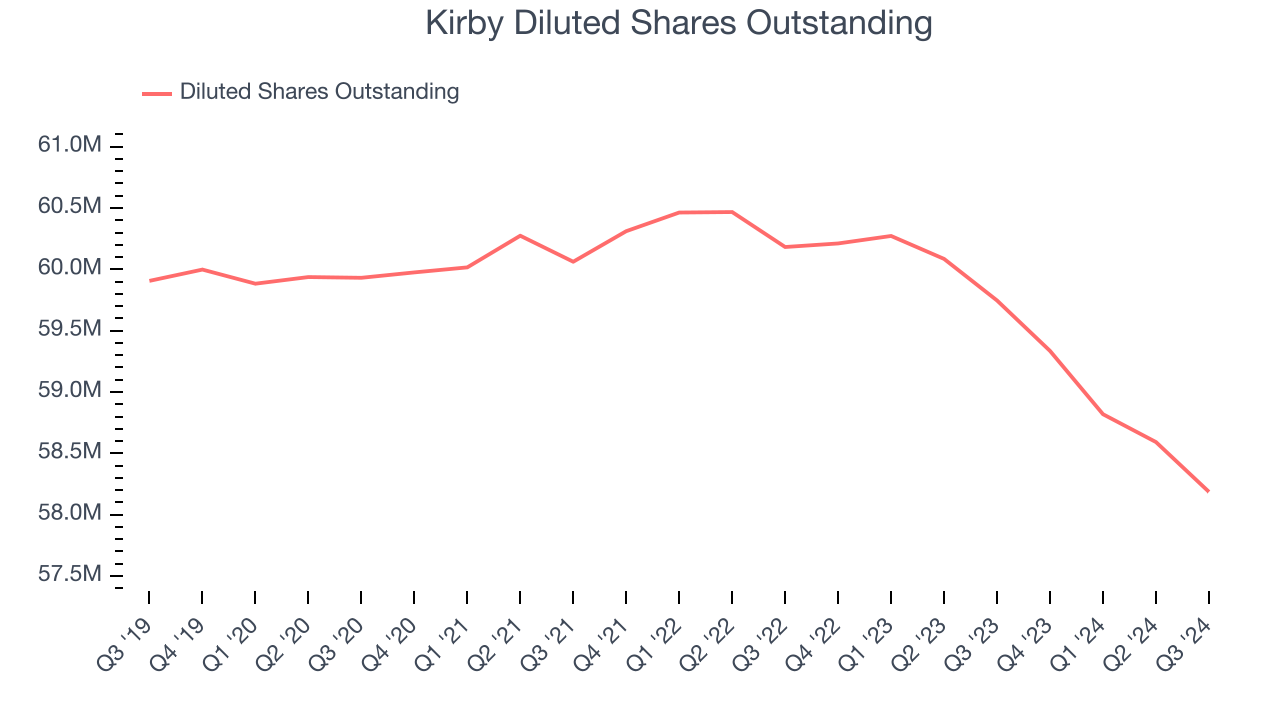
Like with revenue, we analyze EPS over a shorter period to see if we are missing a change in the business.
For Kirby, its two-year annual EPS growth of 81.1% was higher than its five-year trend. We love it when earnings growth accelerates, especially when it accelerates off an already high base.In Q3, Kirby reported EPS at $1.55, up from $1.05 in the same quarter last year. This print beat analysts’ estimates by 5.4%. Over the next 12 months, Wall Street expects Kirby’s full-year EPS of $5.22 to grow by 24%.
Key Takeaways from Kirby’s Q3 Results
We enjoyed seeing Kirby exceed analysts’ EBITDA and EPS expectations this quarter. We were also glad its Distribution and Services revenue topped Wall Street’s estimates. Overall, we think this was a solid quarter with some key areas of upside. The stock remained flat at $123.02 immediately following the results.
Indeed, Kirby had a rock-solid quarterly earnings result, but is this stock a good investment here?If you’re making that decision, you should consider the bigger picture of valuation, business qualities, as well as the latest earnings. We cover that in our actionable full research report which you can read here, it’s free.


