


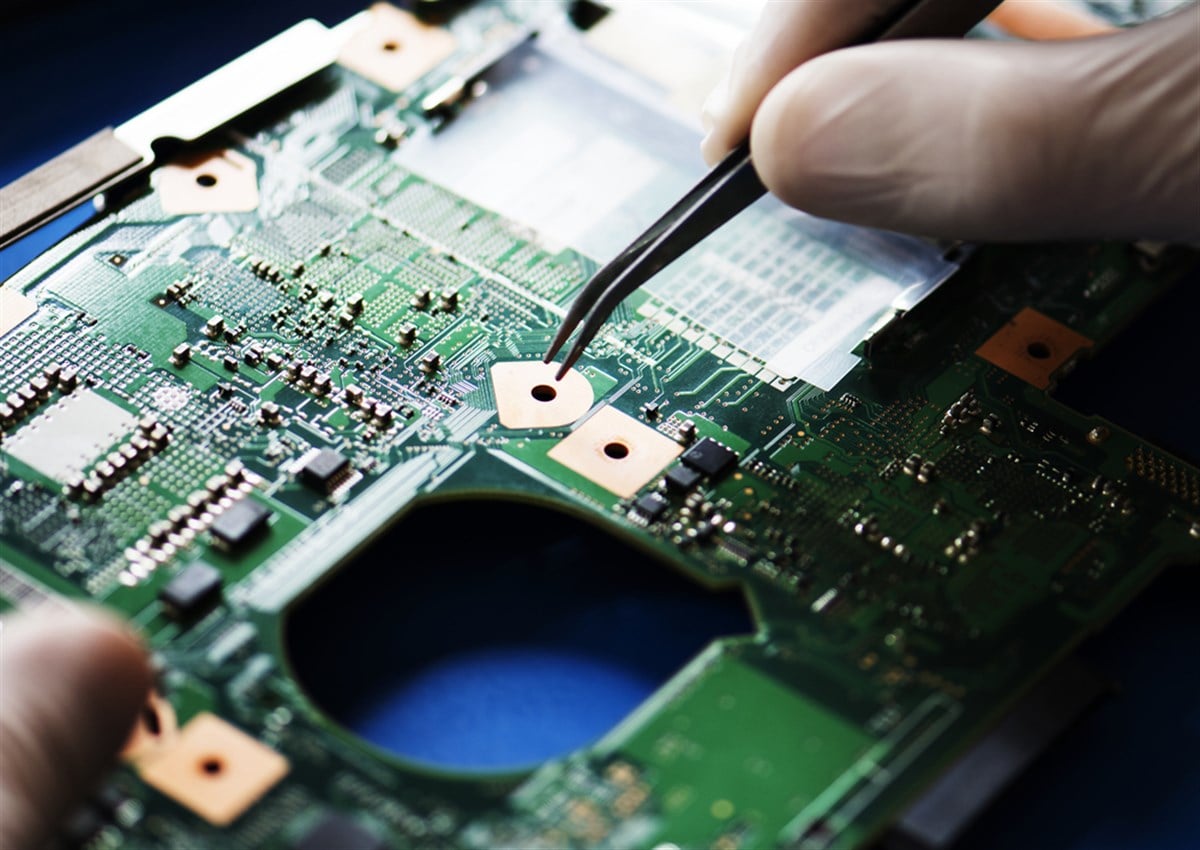
Semiconductor stocks are surging thanks to the artificial intelligence (AI) boom driven by Nvidia Co. (NASDAQ: NVDA) and Advanced Micro Devices Inc. (NASDAQ: AMD). The VanEck Semiconductor ETF is up 28.66% year-to-date (YTD). It’s tough to find a group of semiconductors in the computer and technology sector that are still considered conservatively cheap unless they are severely underperforming or are frankly boring. Remember that most people assume semiconductors are all computer chips, considered integrated circuits (ICs) or microchips containing multiple electronic components that include capacitors, transistors and resistors integrated into a single silicon wafer.
What are Discrete Semiconductors?
Discrete semiconductors are individual electronic components that perform specific electronic functions like controlling and amplifying electric currents or voltages and switching circuits.
Passive electronic components don't require a power source and don’t amplify or control electronic signals but instead store, filter or regulate electrical energy like capacitors and resistors. Here are 2 discrete semiconductor stocks that are both underperforming and a tad boring but may be coming to the bottom of their normalization cycles.
Vishay Intertechnology
Vishay Intertechnology Inc. (NYSE: VSH) happens to have one of the world's largest semiconductor portfolios, supplying electronic components to various end markets from industrial to automotive sectors. Their semiconductors include metal oxide semiconductor field effect transistors (MOSFETs) used for switching and amplifying electronic signals, diodes, and optoelectronic components.
Big Brand OEM Customers
They also have inductors and capacitors as passive electronic components that manage electrical energy flows. Their components are used in 5G and internet-of-things (IoT) networks. Their network of original electronics manufacturer (OEM) customers reads like a who’s who of technology, automotive, healthcare, consumer electronics, to industrial, including companies like Apple Inc. (NASDAQ: AAPL), Tesla Inc. (NASDAQ: TSLA), Sony Co. (NYSE: SNE), Medtronic plc (NYSE: MDT) and Honeywell International Inc. (NASDAQ: HON).
Normalization
On Feb. 7, 2024, Vishay reported an EPS of 37 cents, beating consensus estimates of 36 cents by a penny. Revenues fell 8.2% YoY to $785.24 million versus $787.15 million. The book-to-bill ratio was 0.75, with the end of the quarter backlog of 5.3 months. The company expected Q1 2024 revenues between $715 million to $755 million versus $795.1 million.
CEO Comments
Vishay Intertechnology CEO Joel Smejkal commented, "For the fourth quarter, the trends in inventory adjustments, contracting lead times, and softened demand in industrial end markets became more apparent. While customers continue to digest higher inventory levels, we implemented our strategy to broaden participation with our distribution partners.”
Smejkal concluded, “During this period of inventory adjustment, our strong balance sheet and liquidity give us the resources to continue investing in incremental capacity and preparing Vishay for the long-term demand trends of e-mobility, sustainability and connectivity.
Vishay Intertechnology's peer and competitor stocks can be found with the MarketBeat stock screener.
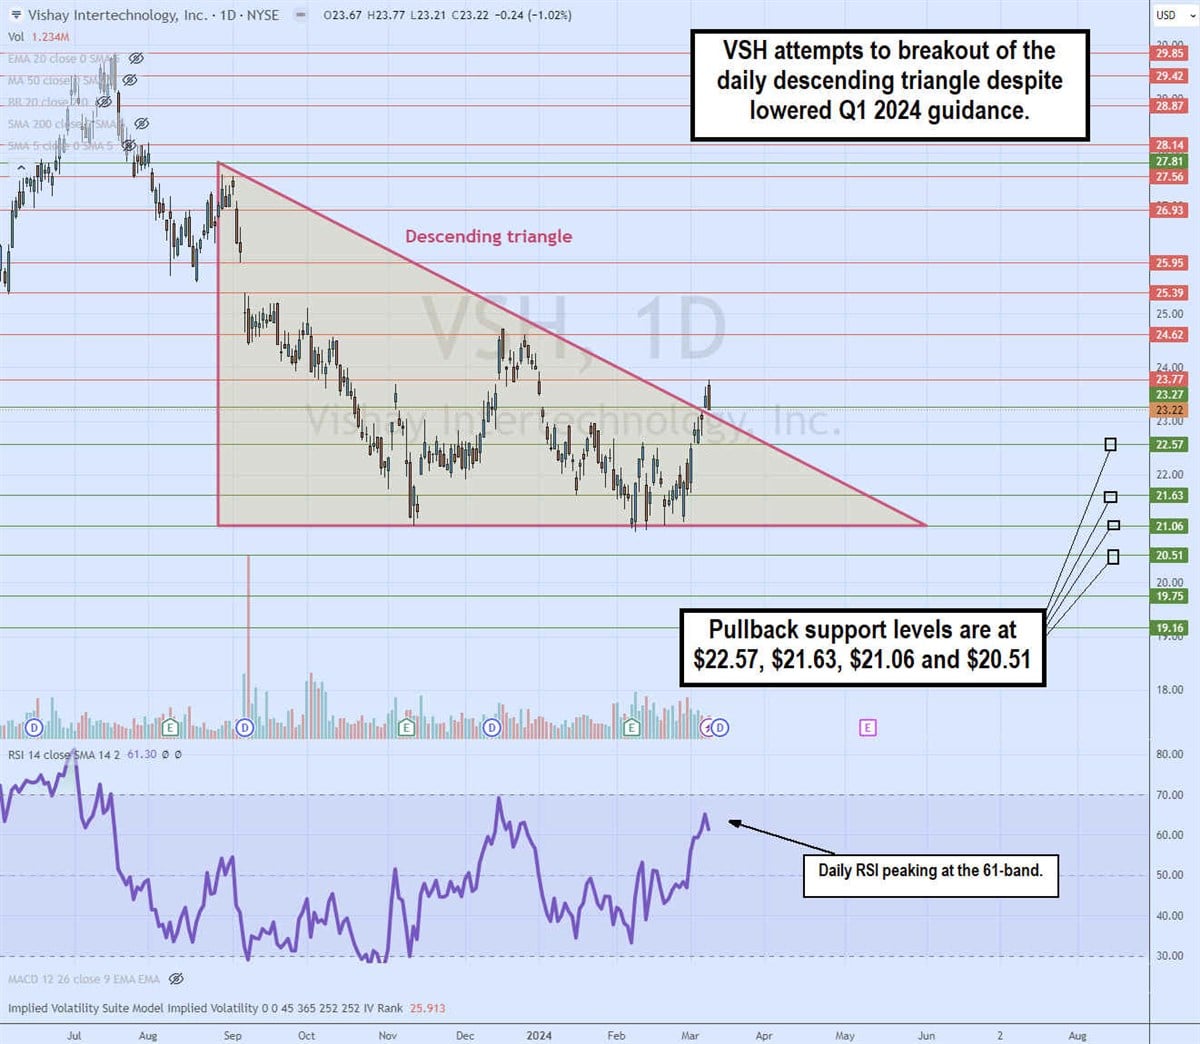
Daily Descending Triangle
The daily candlestick chart on VSH illustrates a descending triangle pattern. The descending trendline started at $27.81, capping bounces at lower highs towards the flat-bottom lower trendline at $21.06.
The Q4 2023 earnings report helped set the stage for a rally that's attempting to break through the descending trendline at $23.22. The daily relative strength index is stalling at the 61-band. Pullback support levels are at $22.57, $21.63, $21.06 and $20.51.
STMicroelectronics
STMicroelectronics N.V. (NYSE: STM) provides automotive microchips and discrete semiconductors. Its components can be found throughout consumer electronics and computer peripherals. STM supplies semiconductors essential for clean energy, solar, car electrification and car digitalization trends. Its discrete semiconductors are found in a large range of low-power, high-performance industrial sensors used in IoT and pressure sensors for airtight and waterproof applications. Get AI-powered insights on MarketBeat.
Q4 2023 EPS Estimate Beat but Missed Revenues
STM reported Q4 2023 EPS of $1.14, beating consensus analyst estimates of 95 cents by 19 cents. Revenues fell 3.2% YoY to $4.28 billion versus $4.31 billion. The gross margin was 45.5%, and the operating margin was 23.9% on a net income of $1.08 billion. Full-year 2023 net revenues were $17.29 billion with a gross margin of 47.9% and an operating margin of 26.7% on a net income of $4.21 billion.
Lowered Forward Guidance
STM issued downside guidance for Q1 2024 revenues of $3.6 billion versus $4.08 billion consensus estimates. Gross margin is expected around 42.3% plus or minus 200 basis points. Full year 2024 revenues are expected between $15.9 billion to $16.9 million versus $17.29 billion consensus estimates with gross margin in the low to mid 40% range.
CEO Insights
Pilgrim’s Pride CEO Fabio Sandri noted that 2023 was a challenging year, but they were able to drive growth under the most difficult circumstances. The affordability and availability of chicken resonated with its customers. The company worked closely with key retail and food service customers to drive increased traffic through promotions.
The company completed the customers of its hatchery and feed mill in Merida, with production expected to commence in March 2024. Sandri commented, “Moving forward, expanding distribution of our existing innovation through retail and further diversifying our portfolio in food service will be key to driving continued growth. Our investments in people over the past few years have resulted in suitable net staffing and reduced turnover levels throughout our US facilities.”
STMicroelectronics analyst ratings and price targets are at MarketBeat.
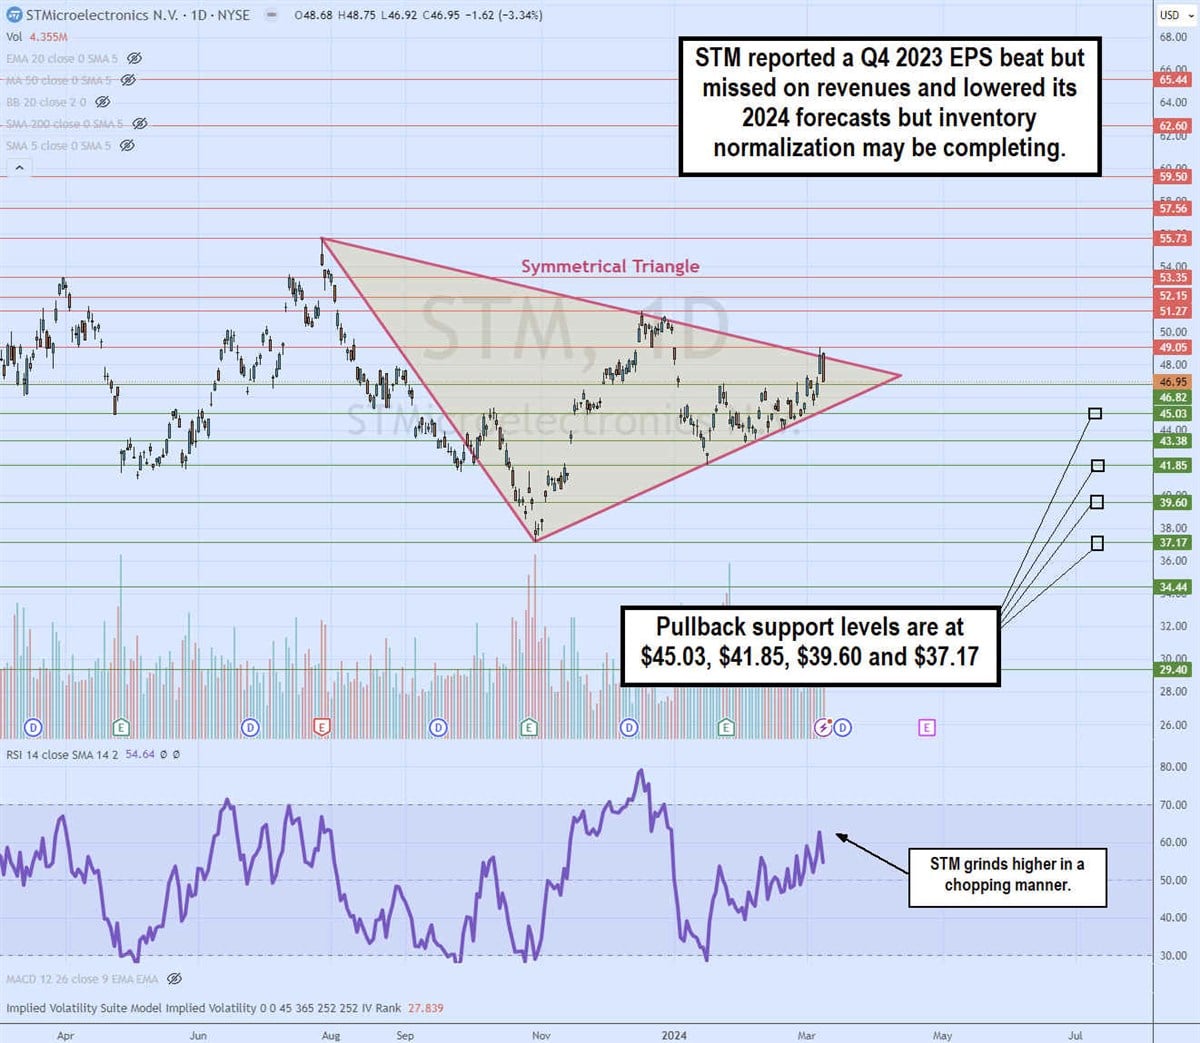
Daily Symmetrical Triangle
The daily candlestick chart on STM indicates a symmetrical triangle pattern comprised of lower highs and higher lows as it nears the apex point. The closer STM gets to the apex, the tighter the range and eventually, a breakout or breakdown will trigger. The daily RSI has been grinding higher but in a very choppy manner as it quickly peaks and then coils up again. Pullback support areas are at $45.03, $41.85, $39.60 and $37.17.
