


The Houthi attacks on cargo ships in the Red Sea have caused widespread disruptions and economic ramifications for the transportation sector, with cargo and dry bulk shipping and oil/energy sector comprised of the oil and gas industry impacting global trade supply chains. The Red Sea plays a crucial role in the transportation of oil and gas and is a vital artery for global trade.
Ships that are avoiding the Red Sea are rerouting their vessels around the horn of Africa, adding extensive fuel and insurance costs of upwards of $1 million per round trip. Insurance premiums for vessels transporting through the Red Sea have shot up 10X.
Supply chain disruptions
The Suez Canal is the shortest distance between Europe and Asia, amounting to nearly 15% of the world's shipping traffic transit. The disruptions will cost the global economy billions. Recently, electric vehicle (EV) giant Tesla Inc. (NASDAQ: TSLA) announced it has to shut down production for at least two weeks at its Gigafactory in Berlin, Germany, due to supply chain issues causing a lack of components for its Model Y production stemming from the disruptions in the Red Sea.
Disruption boosting stock prices
With this much trouble, it would be easy to assume that shipping company stocks are in the toilet. Wrong. Many of these stocks are trading near their 52-week highs like Navios Maritime Partners L.P. (NYSE: NMN), Golden Ocean Group Ltd. (NASDAQ: GOGL) and tankers like Frontline plc (NYSE: FRO) trading up 10.4% year-to-date (YTD) and International Seaways Inc. (NASDAQ: INSW) trading near 52-week highs at $51.96 and up 12.3% YTD. The company that really stands out with a 36.3% YTD gain is ZIM Integrated Shipping Services Ltd. (NYSE: ZIM).
More risk equals higher shipping rates.
Spot freight rates from China to various European destinations have nearly doubled in 2024 due to the disruptions caused by the Houthi attacks in the Red Sea. These higher rates are expected to last through the annual freight contract renegotiations in February 2024. The Drewry’s World Container index anticipates rates to accelerate heading into the Chinese New Year holiday, which lasts from Feb. 10, 2024, and continues for 15 days, concluding on Feb. 24, 2024. ZIM has stated it was fully exposed to spot prices.
U.S and UK, retaliation attacks
On Jan. 11, 2024, the U.S. and U.K. have begun retaliating against the Houthis. U.S. Central Command (CENTCOM) stated that three U.S. destroyers and F-18s and a British warship were noted to have shot down 18 drones and a number of missiles launched from Houthi areas in Yemen. The U.S. has collaborated with several countries to launch a maritime task force called Operation Prosperity Guardian to patrol the Red Sea to curb the Houthi attacks, which haven’t stopped.
It was reported on Jan. 12, 2024, that an IRGC spy ship, Behshad, which is responsible for providing the Houthis with real-time intelligence enabling the Houthis to target ships that have gone silent, was spotted leaving the Red Sea en route back to Iran. The retaliations could resolve the attacks or escalate the situation. If the Red Sea disruptions get resolved by negotiations, ZIM could suffer from oversupply issues causing shares to drop. Further disruptions may cause the stock to short squeeze higher since it has a 24.79% short interest.
ZIM Integrated Shipping Services analyst ratings and price targets are at MarketBeat. ZIM Integrated Shipping peers and competitor stocks can be found with the MarketBeat stock screener.
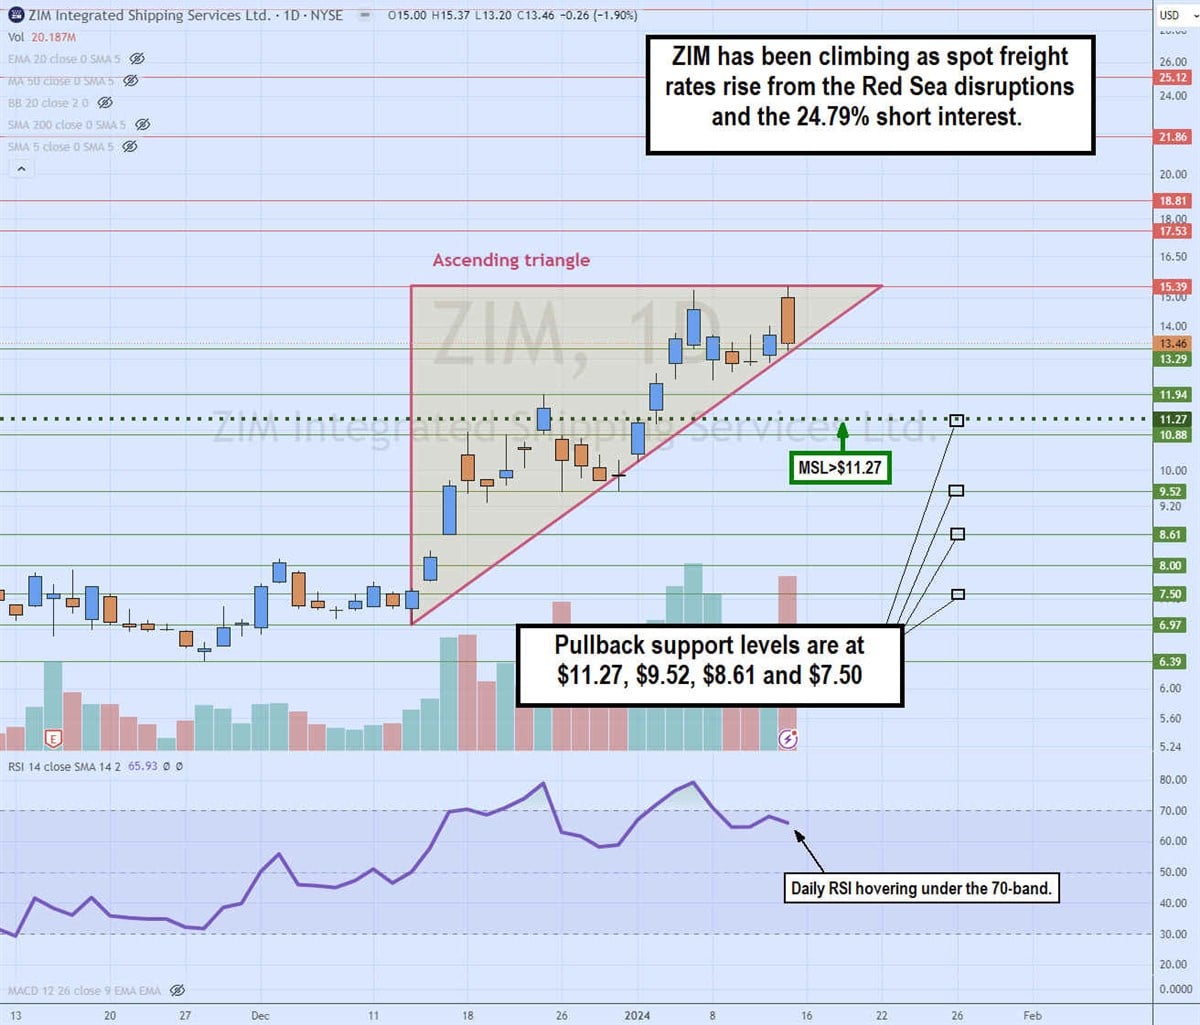
Daily ascending triangle pattern
The daily candlestick chart for ZIM illustrates an ascending triangle pattern. The ascending trendline formed at $6.97 on Dec. 13, 2023. ZIM staged a rally that peaked at $11.94 and formed a four-candle pullback to $9.52, setting up the market structure low (MSL) buy trigger on the breakout through $11.27. The breakout occurred on Jan. 3, 2024, causing shares to rise and form the flat-top horizontal upper trendline at $15.39. The pullbacks held at higher lows before rising again.
ZIM tested the upper and lower trendlines on Jan. 12, 2024, as it gets closer to the apex point setting up the breakout or breakdown. The 200-period simple moving average support is at $12.46, and the 50-period moving average is at $8.97. The daily relative strength index (RSI) slipped under the 70-band but is hovering above the 60-band. Pullback support levels are at $11.27, $9.52, $8.61 and $7.50.
