It is widely known amongst the investing community that attempting to time the markets is often a futile activity. However, when market forces align to demonstrate inevitable points at play, very seldom do investors thank their lucky stars that they did not ride the wave. Today, according to Bloomberg Intelligence, stock traders are piling up on call option purchases at record levels not seen since more than twelve months ago.
This simple metric lays the foundation for a more significant implication, one that investors can safely ride and likely walk away without regrets.
As increased interest in call options implies bullish sentiment in the underlying assets, S&P 500 index, and companies within it in this case, these en masse traders may be weighing in a high probability of the FED pausing its rate hike path this week. Historically, the stock market indices lead the economy in terms of sentiment, considering markets are forward-looking.
The typical suspects leading the view are also a tight circle of financials and small-cap stocks, which is why Buffett's Bank of America (NYSE: BAC) may be the one financial value play investors should take advantage of.
Macro Perfect Storm
Looking back at how Bank of America has behaved throughout the FED's interest rate cycle, as far back as 2014, some significant trends are uncovered. Two critical metrics should be kept in the mind of investors as they navigate the present and prospects of the bank, Loan-to-Deposit ratios alongside the stock's price-to-earnings ratio.
The former (measured as total loans divided by total deposits) could act as a proxy for the economic cycle perceived by the bank's operations, as the ratio's level is heavily correlated with the United States' PMI index, another proxy for economic activity.
The LDR (loan to deposit) ratio for Bank of America reached a high of 78.6% in 2014, just as the effective FED funds rate hovered at roughly 0.09%, alongside a PMI index reading upwards of 58%. These two factors translate into heightened confidence from the bank regarding the country's economic state, as more loans - despite lower rates - would imply a more optimistic take on the future of the underlying borrowers.
As rates rose to 2.4% by 2019 and the PMI index declined to nearly 50%, the LDR ratio at Bank of America fell by 10% to finish the year at 68.6%. As investors digested these moves, their perception of the underlying earnings at the bank was voted in by the P/E ratio carried by the stock.
During the high-volume year of 2014, Bank of America stock sold for 45.0x its earnings; by 2019, this ratio fell to 9.5x as the underlying drivers of the business also contracted. The stock price kept rising despite these contractions, both inside and outside the bank. Net earnings rose from $0.46 per share in 2014 to $2.90 per share in 2019, attributed to both a function of scaling operations and buying back shares. Nonetheless, investors should follow these two metrics closely in the following months, as they both point to the potential ceiling that the stock price may rise toward.
BAC stock could be acquired right before a cyclical rally with both ratios hovering at historical lows, alongside a bottoming PMI and a FED considering pausing its hikes.
Relative Value, a Sign of the Times
There sure is the awareness that Bank of America may be cheaper, as analyst ratings point to a near 26% upside from today's prices. However, comparing the stock price performance to other peers in the group may provide a more insightful viewpoint of where the stock may go. Considering the stock price trajectory of other, more cyclical banks like Goldman Sachs (NYSE: GS) and JP Morgan Chase & Co (NYSE: JPM) can open up a wave for the classic 'relative value' trade.
On a direct comparison, Bank of America sells at a reasonable discount to its peers in this small universe. Goldman Sachs carries a 12.0x P/E ratio, and JP Morgan shows a similar 10.5x ratio, sending BAC's 8.3x ratio into an attractive discount. Considering the stock price performance over the past twelve months, Bank of America has underperformed these names by as much as 27%. To put things into perspective, Bank of America stock is trading at 75% of its 52-week high, a significantly more attractive level than JP Morgan's 98%.
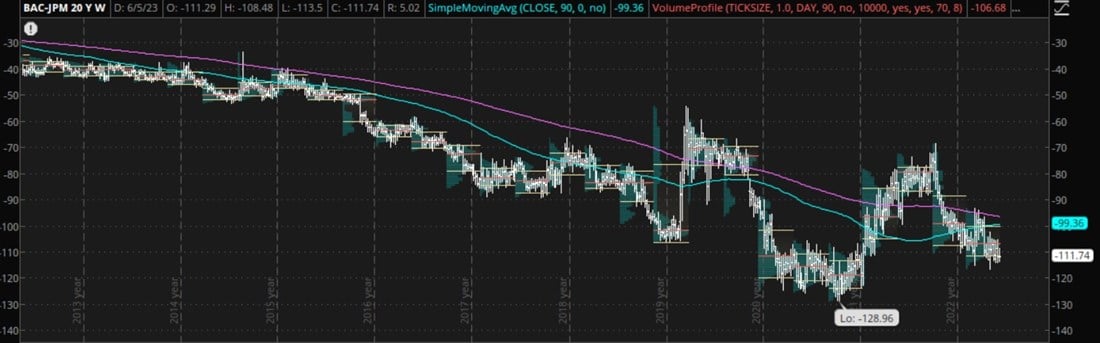
In 2014, when Bank of America's commercial banking activities saw the benefits of economic growth, these dynamics were inverted. As the image reflects, the spread between the two stocks would have favored BAC's outperformance over JPM's lackluster price action. A 'spread' is taking the price of one stock (BAC) and subtracting the price of another (JPM); following this spread will show a current reversed head and shoulders pattern. This pattern typically implies a rally in the underlying. In the case of this particular spread, it would point to Bank of America rising more than JP Morgan.