


There are, as they say, a million ways to make a million dollars. However, for those interested in the financial markets and the underlying asset prices that fluctuate from Monday to Friday, there are really only two main ways. The most direct and orthodox avenue to make a dollar - or a million, depending on investment return targets - is via the appreciation of said asset. Using stocks as an example, this would translate to owning shares in a company that increases in value. While dividend payouts represent a secondary method of income in financial assets (stocks, in this case), earning capital gains through appreciation is the most commonly experienced trajectory and the one that really moves the net worth needle for investors.
Day traders, swing traders, options traders, and even long-term value investors are all looking for price fluctuations to the upside (unless they are shorting the markets, in which case they hope prices will decrease). What really delivers a paycheck to them is the manic-depressive beast called volatility. Traders are slaves to volatility, since volatile markets allow them to execute in-and-out trades faster than a slow market would. Investors also secretly love volatility, as it usually brings along a period of increased fear in the markets, and fear often results in lower prices for these investors to deploy capital into discounted assets.
Volatility Breakout in Bank of America
Pencils out, this is a lesson on analyzing and timing trades as the "pros" do it. The Goldman Sachs Group (NYSE: GS) trains its traders on volatility timing through tools like the Average True Range (ATR) and deviations from a stock's twenty day moving average. According to annual report data, Goldman's trading department usually experiences losing trading days in the range of 25-35 out of 252, translating to 86-90% of trading days being money-making days. Given this statistic, it would be useful to follow this volatility and trade or invest around it.
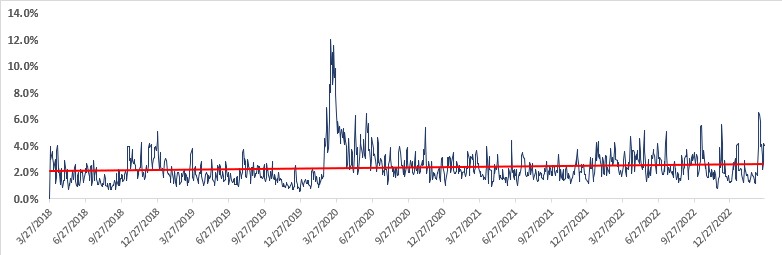
Volatility in Bank of America (NYSE: BAC) stock has broken out to its highest levels since the COVID-19 pandemic measured by its ATR chart above. Investors - and traders alike - can appreciate the effects of this volatility breakouts in the recent stock price declines from $34 per share in the beginning of March to a current $27.14, which translates to roughly a 20% decline in less than a month.
This stock's yearly average ATR (252 days total) is 2.4%. The last five days of trading brought an average of 3.5% for Bank of America. Such a breakout, coupled with 52-week low prices, could trigger a buying spree in the stock.
Faith in a Rally
Bank of America saw $15 billion USD in new deposits ever since regional banks started to face liquidity crunches when Silicon Valley Bank (NASDAQ: SIVB) announced its collapse. This new injection, coupled with higher interest rates and consumer trends, could imply increased upside in the stock. It currently carries a book value per share of $43.50 and trades at a price-to-earnings ratio of 8.2x, the lowest in almost a decade excluding COVID-19.
Technical analysis would suggest a strong support area (price ranges where buying pressure has historically increased) in the $25.75 to $28.15 range. The stock is currently in that range, which also happens to represent the "golden ratio" of Fibonacci retracements, within 61.8% and 78.6%.
Lastly, on top of all of these bullish signals, weekly indicators such as RSI and Stochastics seem to be showcasing bullish divergences out of "oversold" ranges.
Back to the Norm
A very useful "sanity gauge" that professional traders use is a stock's price deviation from its twenty-day moving averages. When historical standard deviations from these averages are exceeded, stocks tend to revert back to normal levels. A useful way to picture this phenomenon is to think about planets orbiting the sun, there is a set and defined path of orbit which carries a normal standard deviation, when a planet hits this standard deviation from a normal orbiting path it can be expected to return back to the norm.
Taking any day's Bank of America stock price and subtracting it from the twenty-day moving average computes the "spread" between these two values. Charting out the spread and its data can point out its standard deviation levels. When volatility increases (such as right now), these deviations will hit and even exceed. Every time this happens, whether to the upside or downside, the stock has historically returned to its twenty-day moving average in due time.
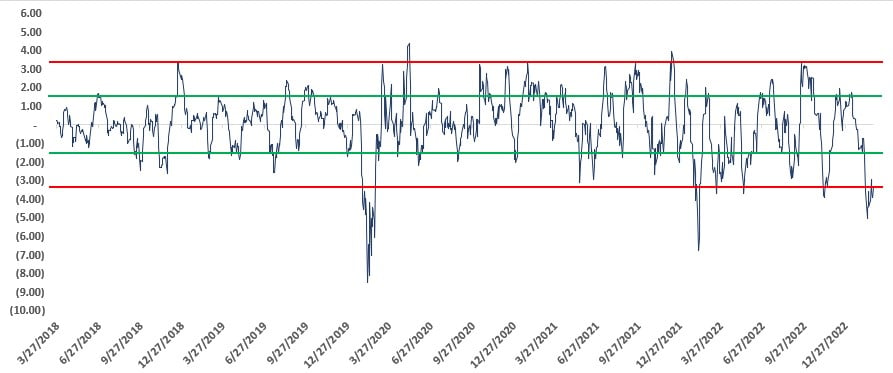
The image above represents the current state of deviation in Bank of America stock, a downside three standard deviations is an event that has only happened 3 times in the past five years, and March 2023 has been one of them. Comparing these deviations to the actual stock price movements brings, on average, a 120% to 150% upward rally shortly after.
Keeping in mind all of these positive drivers setting Bank of America stock up for an ensuing rally, investors and traders would be well served by adding this household mega bank name to their watchlists.
