


Since hitting 52-week lows in March, Goldman Sachs (GS) has been trending higher. As it does, a trend line and a support level have formed, which can be helpful to investors looking to trade this stock.
A trend line is a straight line connecting at least two price points and then extends into the future to act as a line of support or resistance. It’s my opinion that any 2 points can start a trend line but when the stock tests the trend line 3 times or more, it becomes more relevant.
In this case, GS has tested it’s trend line (blue) 5 times in the past 3.5 months.
Also in the chart below, you’ll see that I have identified a support level (green) at $195.
Notice that right now the trend line and the support level are intersecting at $195.
Take a look at the 1-year chart of GS below with added notations:
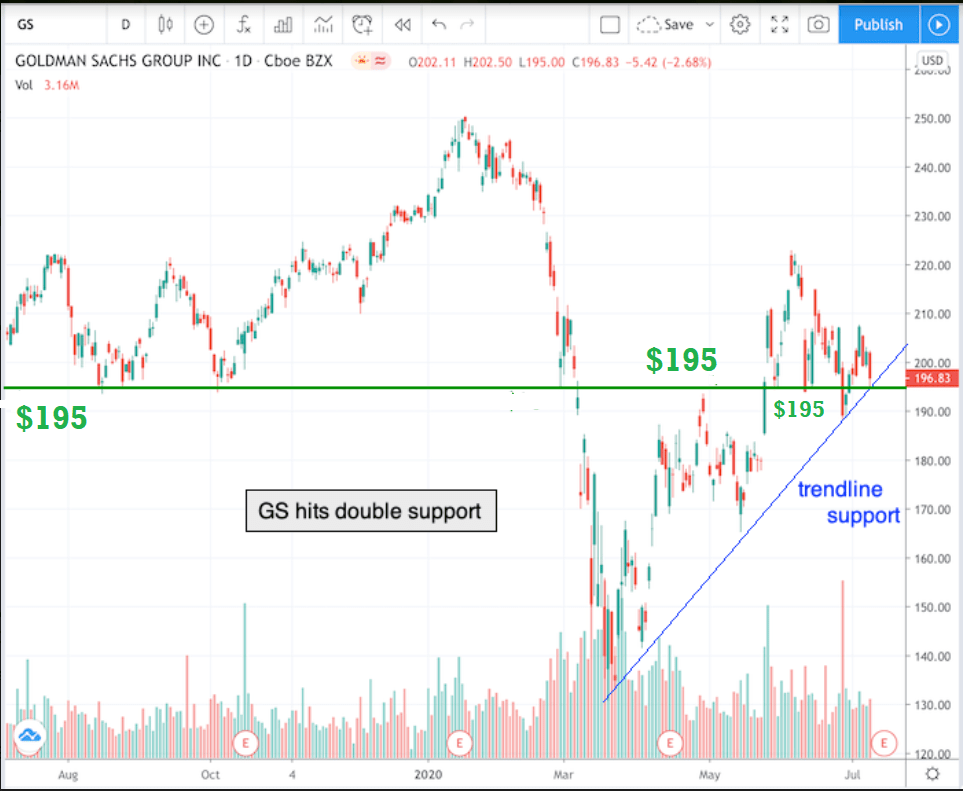
Chart of GS provided by TradingView
If GS falls under $195, a trader could enter a short position with the expectation that there will be a breakdown lower in the stock price because the trendline and support level would be breached.
Why could this stock move lower? Because banks have been hit hard COVID-19. GS is currently trading about 20% off it’s 52-week high, as the S&P 500 is only down about 7%.
Keep an eye on GS and be mindful of their next earnings report which will be released on August 10th.
Have a good trading day!
Christian Tharp, CMT
@cmtstockcoach
Stock Trading & Investing for Everyone
Want More Great Investing Ideas?
9 "BUY THE DIP" Growth Stocks for 2020
Is the Bull S#*t Rally FINALLY Over?
7 "Safe-Haven" Dividend Stocks for Turbulent Times
Top 3 Investing Strategies for 2020
GS shares were trading at $200.73 per share on Friday morning, up $3.90 (+1.98%). Year-to-date, GS has declined -11.62%, versus a -1.31% rise in the benchmark S&P 500 index during the same period.
About the Author: Christian Tharp

Christian is an expert stock market coach at the Adam Mesh Trading Group who has mentored more than 4,000 traders and investors. He is a professional technical analyst that is a certified Chartered Market Technician (CMT), which is a designation awarded by the CMT Association. Christian is also the author of the daily online newsletter Todays Big Stock.
The post Chart of the Day: Goldman Sachs (GS) appeared first on StockNews.com